NB: The statistics we’re working with here have more problems with them than we’d like for a number of reasons, as we’ll explain in the post. So drawing any major conclusions from them about how abortion numbers have changed since legalisation is premature: we’ll return to this topic when more complete statistics become available.
A further complication is that the various statistics which we’ve collated here cover different periods of time within a year. Some statistics are collected over a calendar year (England & Wales abortion statistics), others are over a 12 month period (Northern Irish abortions) , and other are over an unusual 6 months period within a particular year (NI abortion statistics 2020).
Perhaps somewhat surprisingly, the Health Ministry in Northern Ireland released updated statistics over the weekend detailing abortions carried out since the procedure became legal there on 31st March of this year.
For some background details of how this change in the law came to be, check out this blog we wrote at the time.
It is perhaps surprising for someone living under the Republic of Ireland’s new abortion regime that the northern Health Ministry is so willing to give statistical updates. As we wrote at the time, our statistics are a mere shadow of those collected elsewhere, particularly in England and Wales.
The statistics, seen by the Belfast Telegraph, cover the initial 6 month period of the new law’s operation, from April to September of this year.
In total, there were 664 abortions carried out in Northern Ireland during this period.
According to the Telegraph, “over 600” of these were pill-induced abortions (usually labelled ‘medical abortions’).
Comparing these figures to the number of abortions in previous years is complicated by a number of factors, so we won’t be doing so: we’ll wait until year’s end.
The fact that neither births nor abortions are spread evenly across a year, the impact of the pandemic, the lack of data on 2020 abortions from England, Wales and Scotland (where women from the North may have gone for abortions in the first three months of 2020), and the fact that Irish abortion statistics do not record whether or how many women from the North travelled across the border for an abortion, mean any meaningful comparison with previous years on the basis of the North’s April-September abortions is impossible. What we will do is give an idea of what the number of abortions was in the North before legalisation, so we have an idea of what to compare those year-end figures to.
Estimating the Northern abortion rate for previous years is not without its own issues. We want to add together legal abortions carried out in Northern Ireland to abortions carried out on women from the North in England, Scotland, and Wales; as well as an estimate for abortion pills.
As we’ve pointed out in previous blogs, some of the largest suppliers of illegal abortion pill only release figures for the total numbers of pills shipped to the island of Ireland, with no breakdown between North and South. One option for the abortion pill estimate for the North in previous years is just to make it population-based: in 2019 Northern Ireland’s population was roughly 27% of that of the whole island, so we’re could assume that the number of pills shipped to the North was 27% of the total too. (For how we estimate that total, see our previous blogs. *Links*)
One problem with this approach is that our estimates for illegal pill abortions in the last couple of years were already generous compared to those made by the then Minister for Health and various pro-choice groups *link to that follow up blog*. Another is that based on the figures from England and Wales, Northern Ireland has historically had fewer abortions than the Republic per head of population. In 2018, there was one abortion carried out on a woman from Northern Ireland in England and Wales per 1787 people in Northern Ireland. (1.882 million people and 1053 abortions). The equivalent figure for the Republic in 2018 was one abortion for every 1678 people (4.83 million people and 2,879 abortion). So it wouldn’t be unreasonable to think that abortion pill use might also be lower in the North.
To make matters worse again, figures for abortions carried out in the North don’t cover the same time period as figures for abortions carried out in England and Wales. The Northern figures span 12-month periods that overlap with two calendar years: which months they cover isn’t actually specified on the statistical releases. We’ve grouped them with the first year they cover for now (so 2007/2008’s figures are included with 2007’s) but we’re reaching out to Northern Ireland’s Department of Health to clarify.
These ambiguities are hard to resolve: there’s work to be done on how to address them in future analyses.
For now, we’ll just present all the figures including our original generous abortion pill estimate for the island of Ireland adjusted for the North’s population, and a graph showing abortions performed on women from Northern Ireland in England and Wales.
TABLE 1
| Year | In NI* | In Eng/Wales | In Scotland | Pills (Estimate based on our previous blogs) | Rough Total** |
| 2007 | 57 (2006/07) | 1343 | ? | 78 | 1478 |
| 2008 | 47 (2007/08) | 1173 | 2 (less than 20 between 2008-17) | 93 | 1315 |
| 2009 | 44 (2008/09) | 1123 | 2 (less than 20 between 2008-17) | -112 | 1281 |
| 2010 | 36 (2009/10) | 1101 | 2 (less than 20 between 2008-17) | 134 | 1273 |
| 2011 | 35 (2010/11) | 1007 | 2 (less than 20 between 2008-17) | 195 | 1239 |
| 2012 | 35 (2011/12) | 905 | 2 (less than 20 between 2008-17) | 207 | 1149 |
| 2013 | 51 (2012/13) | 802 | 2 (less than 20 between 2008-17) | 243 | 1098 |
| 2014 | 23* (2013/14) | 837 | 2 (less than 20 between 2008-17) | 256 | 1118 |
| 2015 | 16 (2014/15) | 883 | 2 (less than 20 between 2008-17) | 350 | 1251 |
| 2016 | 16 (2015/16) | 724 | 2 (less than 20 between 2008-17) | 426 | 1168 |
| 2017 | 13 (2016/17) | 861 | 2 (less than 20 between 2008-17) | 498 | 1374 |
| 2018 | 12 (2017/18) | 1053** | 9 (max – 2018) | 583 | 1657 |
| 2019*** | 8 (2018/19) | 1014 | ? | 700 | 1722 |
* Does not cover the same time periods as the other statistics.
** Adding the NI statistics to the other ones is problematic because of the different time period: due to this and other factors mentioned, these totals are extremely provisional.
*** There may also have been some 2019 NI abortions carried out in the Republic.
GRAPH 1: Northern Irish Abortions (Carried out in England and Wales)
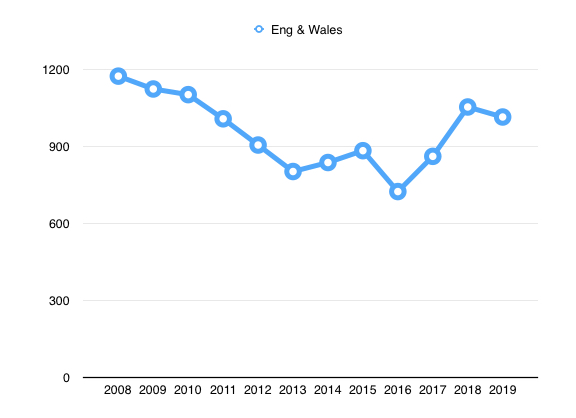
There is one piece of interesting information that we can get from this graph. The UK Government on 29 June 2017 announced that it would fund, via the Government Equalities Office (GEO), abortions for Northern Irish women, who travel to England and Wales for the procedure. The Central Booking System went live on 8th March 2018. It is interesting to note that the number of NI women having abortions seemed to increase fairly significantly the year that this system of free abortions was introduced.
In conclusion, the number we have for April-September of this year is 664. And the main thing we can say about comparing this figure to previous years is that there’s not very much that can be said yet, and you should be suspicious of any analyses that tries to take this figure and use it to draw any broad conclusions about what impact legalisation has had on the number of abortions in the North. For that, we’re going to have to wait at least until we get a full year of stats.
Ben and Gavin
***
https://www.health-ni.gov.uk/publications/northern-ireland-termination-pregnancy-statistics-201718
